
Ask a veteran line inspector what the hardest part of the job is and you rarely hear “the defects.” You hear “the hours.” Spotting a scratched housing at 9 a.m. is easy. Spotting the same scratch at 3 p.m., after thousands of near-identical parts have slid past, is another matter entirely. Attention drifts. It’s human, and no amount of coffee fully fixes it.
That gap between what a plant needs from its inspectors and what any person can sustain is the reason industrial vision systems have gone from a specialist curiosity to a standard line item in factory budgets. A camera doesn’t care that it’s the end of a shift. It applies the same standard to part number 40,000 as it did to part number one.
What an Industrial Vision System Really Is
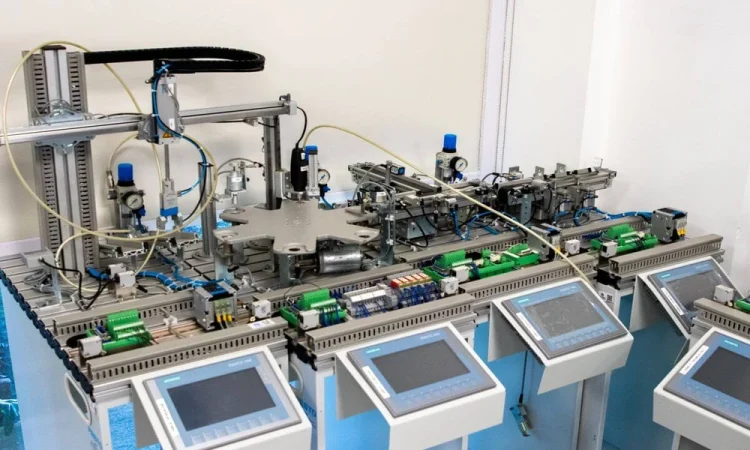
People often picture a single camera pointed at a conveyor belt. The reality is closer to a small, tightly tuned instrument. There’s the camera and lens, yes, but also purpose-built lighting, a mounting arrangement that keeps everything stable despite vibration, a processing unit, and the software that turns pixels into a decision: pass, fail, or “send this one to a person.” Remove any of those pieces, or specify one badly, and the whole thing underperforms.
Engineers sometimes draw a line between machine vision and computer vision. The first is a systems-engineering discipline focused on getting reliable, repeatable results in a factory; the second is the broader computer-science field behind it. The machine vision overview on Wikipedia lays that distinction out neatly, and it’s a useful read if you’re new to the area. In practice, a good installation borrows from both worlds, and teams like Industrial Vision Systems spend as much time on optics and lighting as they do on the AI model sitting behind them.
Where AI Changed the Game
For years, vision inspection meant writing explicit rules. Is the cap present? Is the label within two millimetres of where it should be? Those checks are still valuable, and for simple jobs they remain the cheapest, most predictable answer.
Trouble starts when the defect can’t be described in a sentence. Think of a faint discolouration on a moulded part, or a weld bead that is almost, but not quite, right. Writing rules for that is a nightmare, because every new variation spawns another rule, and the rulebook slowly turns into a tangle nobody dares touch. Deep learning flips the approach. Instead of describing the defect, you show the system hundreds or thousands of good and bad examples and let it work out what separates them. It’s less like programming and more like training a new hire, with the advantage that the new hire never forgets and never quits.
The Part Nobody Puts in the Brochure
Here’s where reality bites. A model that scores brilliantly on a tidy set of lab images can stumble badly on a live line. Sunlight creeps through a loading-bay door in the afternoon. A lens gets a film of oil mist. A supplier changes the surface finish on a component and suddenly half the parts look “wrong” to a model that never saw that finish before.
Experienced integrators plan for this from the start. They collect training images across different shifts, seasons, and batches. They build in a way for operators to flag mistakes, and they retrain on those corrections. And they treat false rejects as seriously as missed defects, because a system that cries wolf gets switched off by frustrated staff within a month. An inspection tool that nobody trusts is worse than none at all.
Turning Inspection Data into Something People Use
A running system produces a flood of information: pass rates by hour, defect types by machine, trends by supplier batch. Raw numbers like that rarely help the people who actually need to act on them, such as shift supervisors and plant managers who aren’t data specialists. What helps is presenting the right two or three signals, clearly. If you want a good primer on that skill, this piece on data visualisation for non-technical audiences makes the case that good charts are about translation rather than decoration, which is exactly the mindset a factory dashboard needs. A simple trend line showing defects creeping up on one machine will prompt a maintenance check far faster than a spreadsheet of thousands of rows.
Counting the Return Honestly
The obvious savings are easy to tally: fewer faulty items reaching customers, less rework, and fewer people tied up in repetitive checking. Many plants redeploy those staff to more skilled work rather than cutting roles, which tends to go down better on the floor.
Subtler gains show up later. Because every inspected part leaves an image and a timestamp behind, quality teams can trace a problem back to a specific batch, tool, or shift instead of quarantining everything built that week. In regulated sectors, that audit trail alone can justify the investment. And over months, the accumulated data starts revealing slow drifts, like a press that is gradually wearing, that nobody would have caught by eye.
Getting Started Without Overreaching
The plants that succeed rarely begin with a grand, factory-wide rollout. They pick one inspection point where defects are costly and well understood, prove the system there, and expand once the team trusts it. A few practical questions are worth settling before spending anything. How many defect examples can you realistically collect? What does a bad part actually cost you? Who will own the system after installation, and who gets the alert when it flags something?
Get those answers straight and the technology does the rest. Factories have always depended on careful observation. Vision systems simply let that observation run at full attention, around the clock, so the people on the floor can spend their own attention on the problems that really need a human mind.